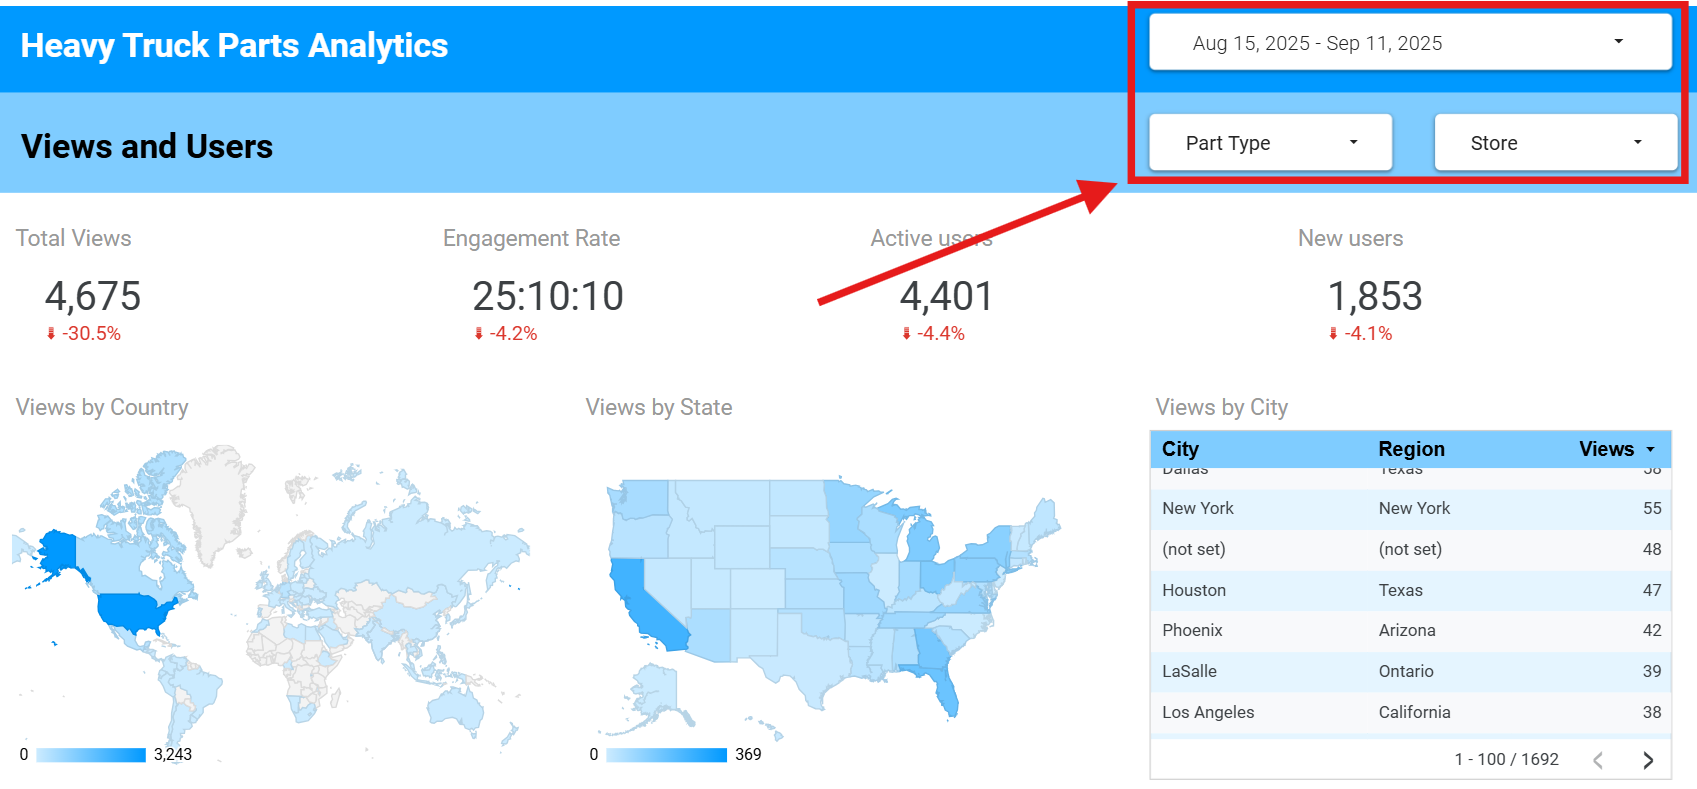
A few pre-configured dashboard charts are available to you examine your listing activity on HeavyTruckParts.Net. This data is filtered to show only activity for your parts listed under your account.
These charts can be added to any dashboard report. However, it is recommended to display them at their largest size for easiest navigation.
General Notes and Filters
All the charts use a similar set of top-level filters for date range and store. Some charts also have an option to filter the results by part type.
If you reload a chart, it will default back to the original default filter values.
All charts are using Google Tags and Google Analytics, however some users may opt out of data tracking. In these cases, activity might be logged, but nothing that tracks that user. It should be noted that generally the tracking data is imprecise, and shouldn’t be used as an absolute measurement.
Date Filtering
Each chart has a default date range, and will load either the most recent week’s worth of data or the most recent month’s worth of data.
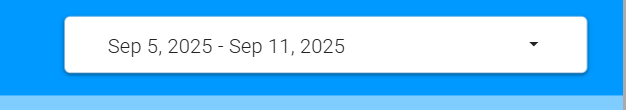
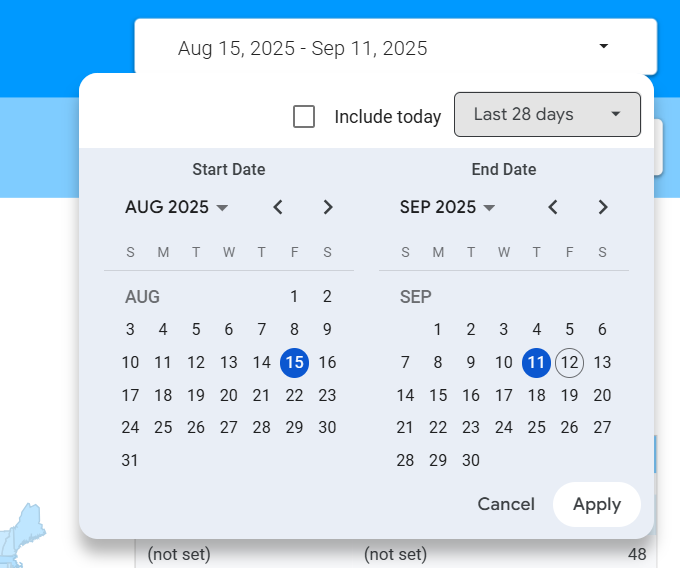
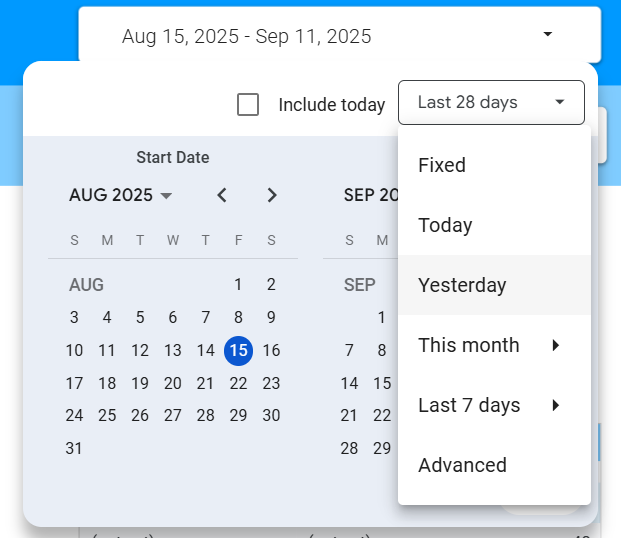
Click in the date range to set a new date range. You can either pick specific start and end dates, or use one of the pre-selected range options in the menu.
Large date ranges may impact the performance of the chart. It’s recommended that you keep the range similar to the default range in the chart.
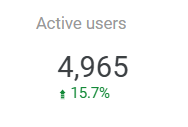
Some of the measured values provide a comparison number below. This always reflects the amount of change since the last date range period, and will change when you change dates. For example, if your chart loads the current week, the comparison total is to the previous week. If you run the chart for 30 days starting June 1st, the comparison total will compare the previous 30 days preceding June 1st.
Store and Part Type Filters
If your yard uses more than one store, you can filter most of the chart data by store. By default, all stores will be included in the chart. The store number in the menu is the same as the store number in your ITrack data.

Some charts also have a Part Type filter. Part Types that are loaded in the chart will appear in the menu.
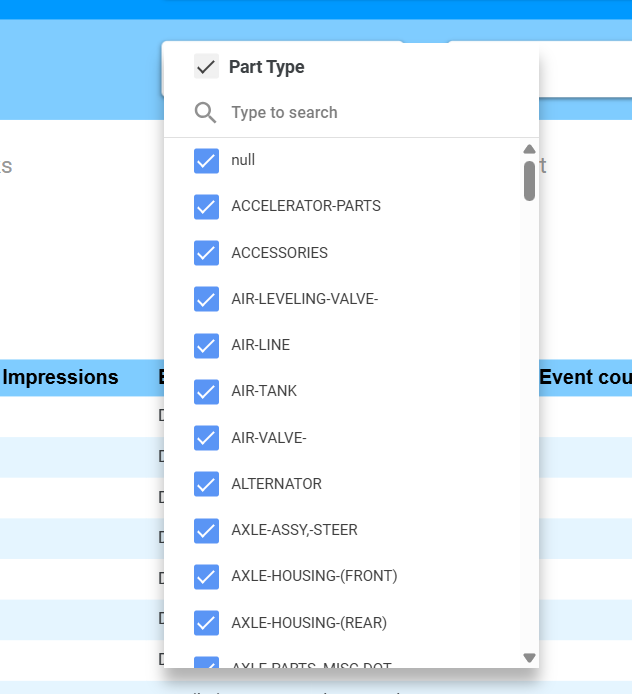
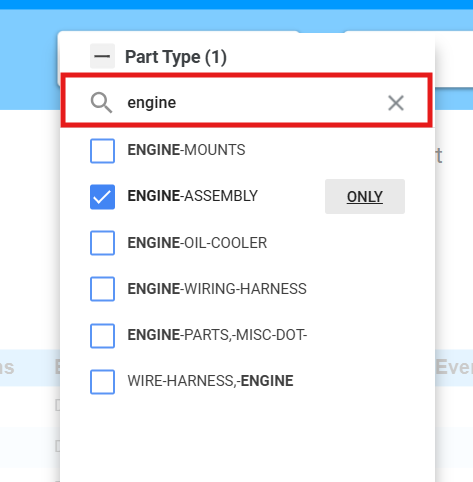
Both of these filters are searchable. The Part Type filter especially can get very long, so it is recommended to use the search to find a specific part type instead of scrolling to find it.
Use the checkboxes to indicate which items to include. You can have more than one item selected, for example if you want to view both transmission assemblies and miscellaneous transmission parts.
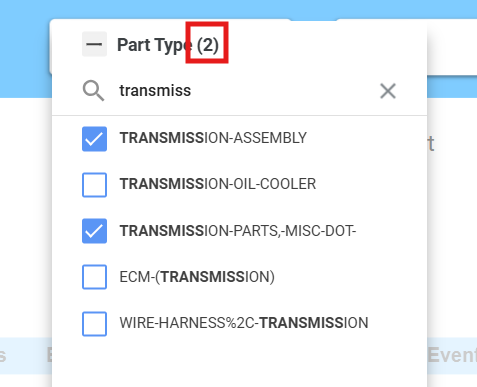
At the top of the menu, you will see a number in parentheses that indicates how many items you have selected in the menu.
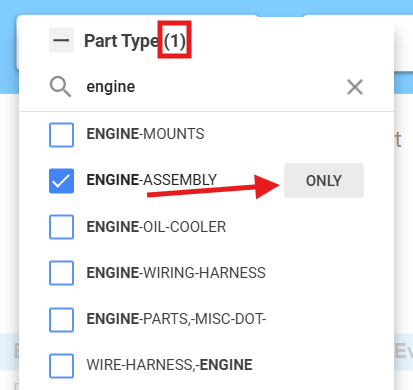
If you only want one item selected, hover over that item and an Only button will appear. Clicking that will uncheck every other item in the list.
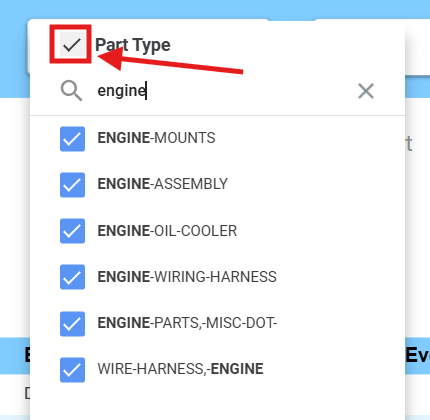
If you want to return to viewing all items, use the checkbox at the top next to the label to toggle all items checked or unchecked.