The Dashboard page displays any reports that you have created along with the charts that are included in the reports.
-
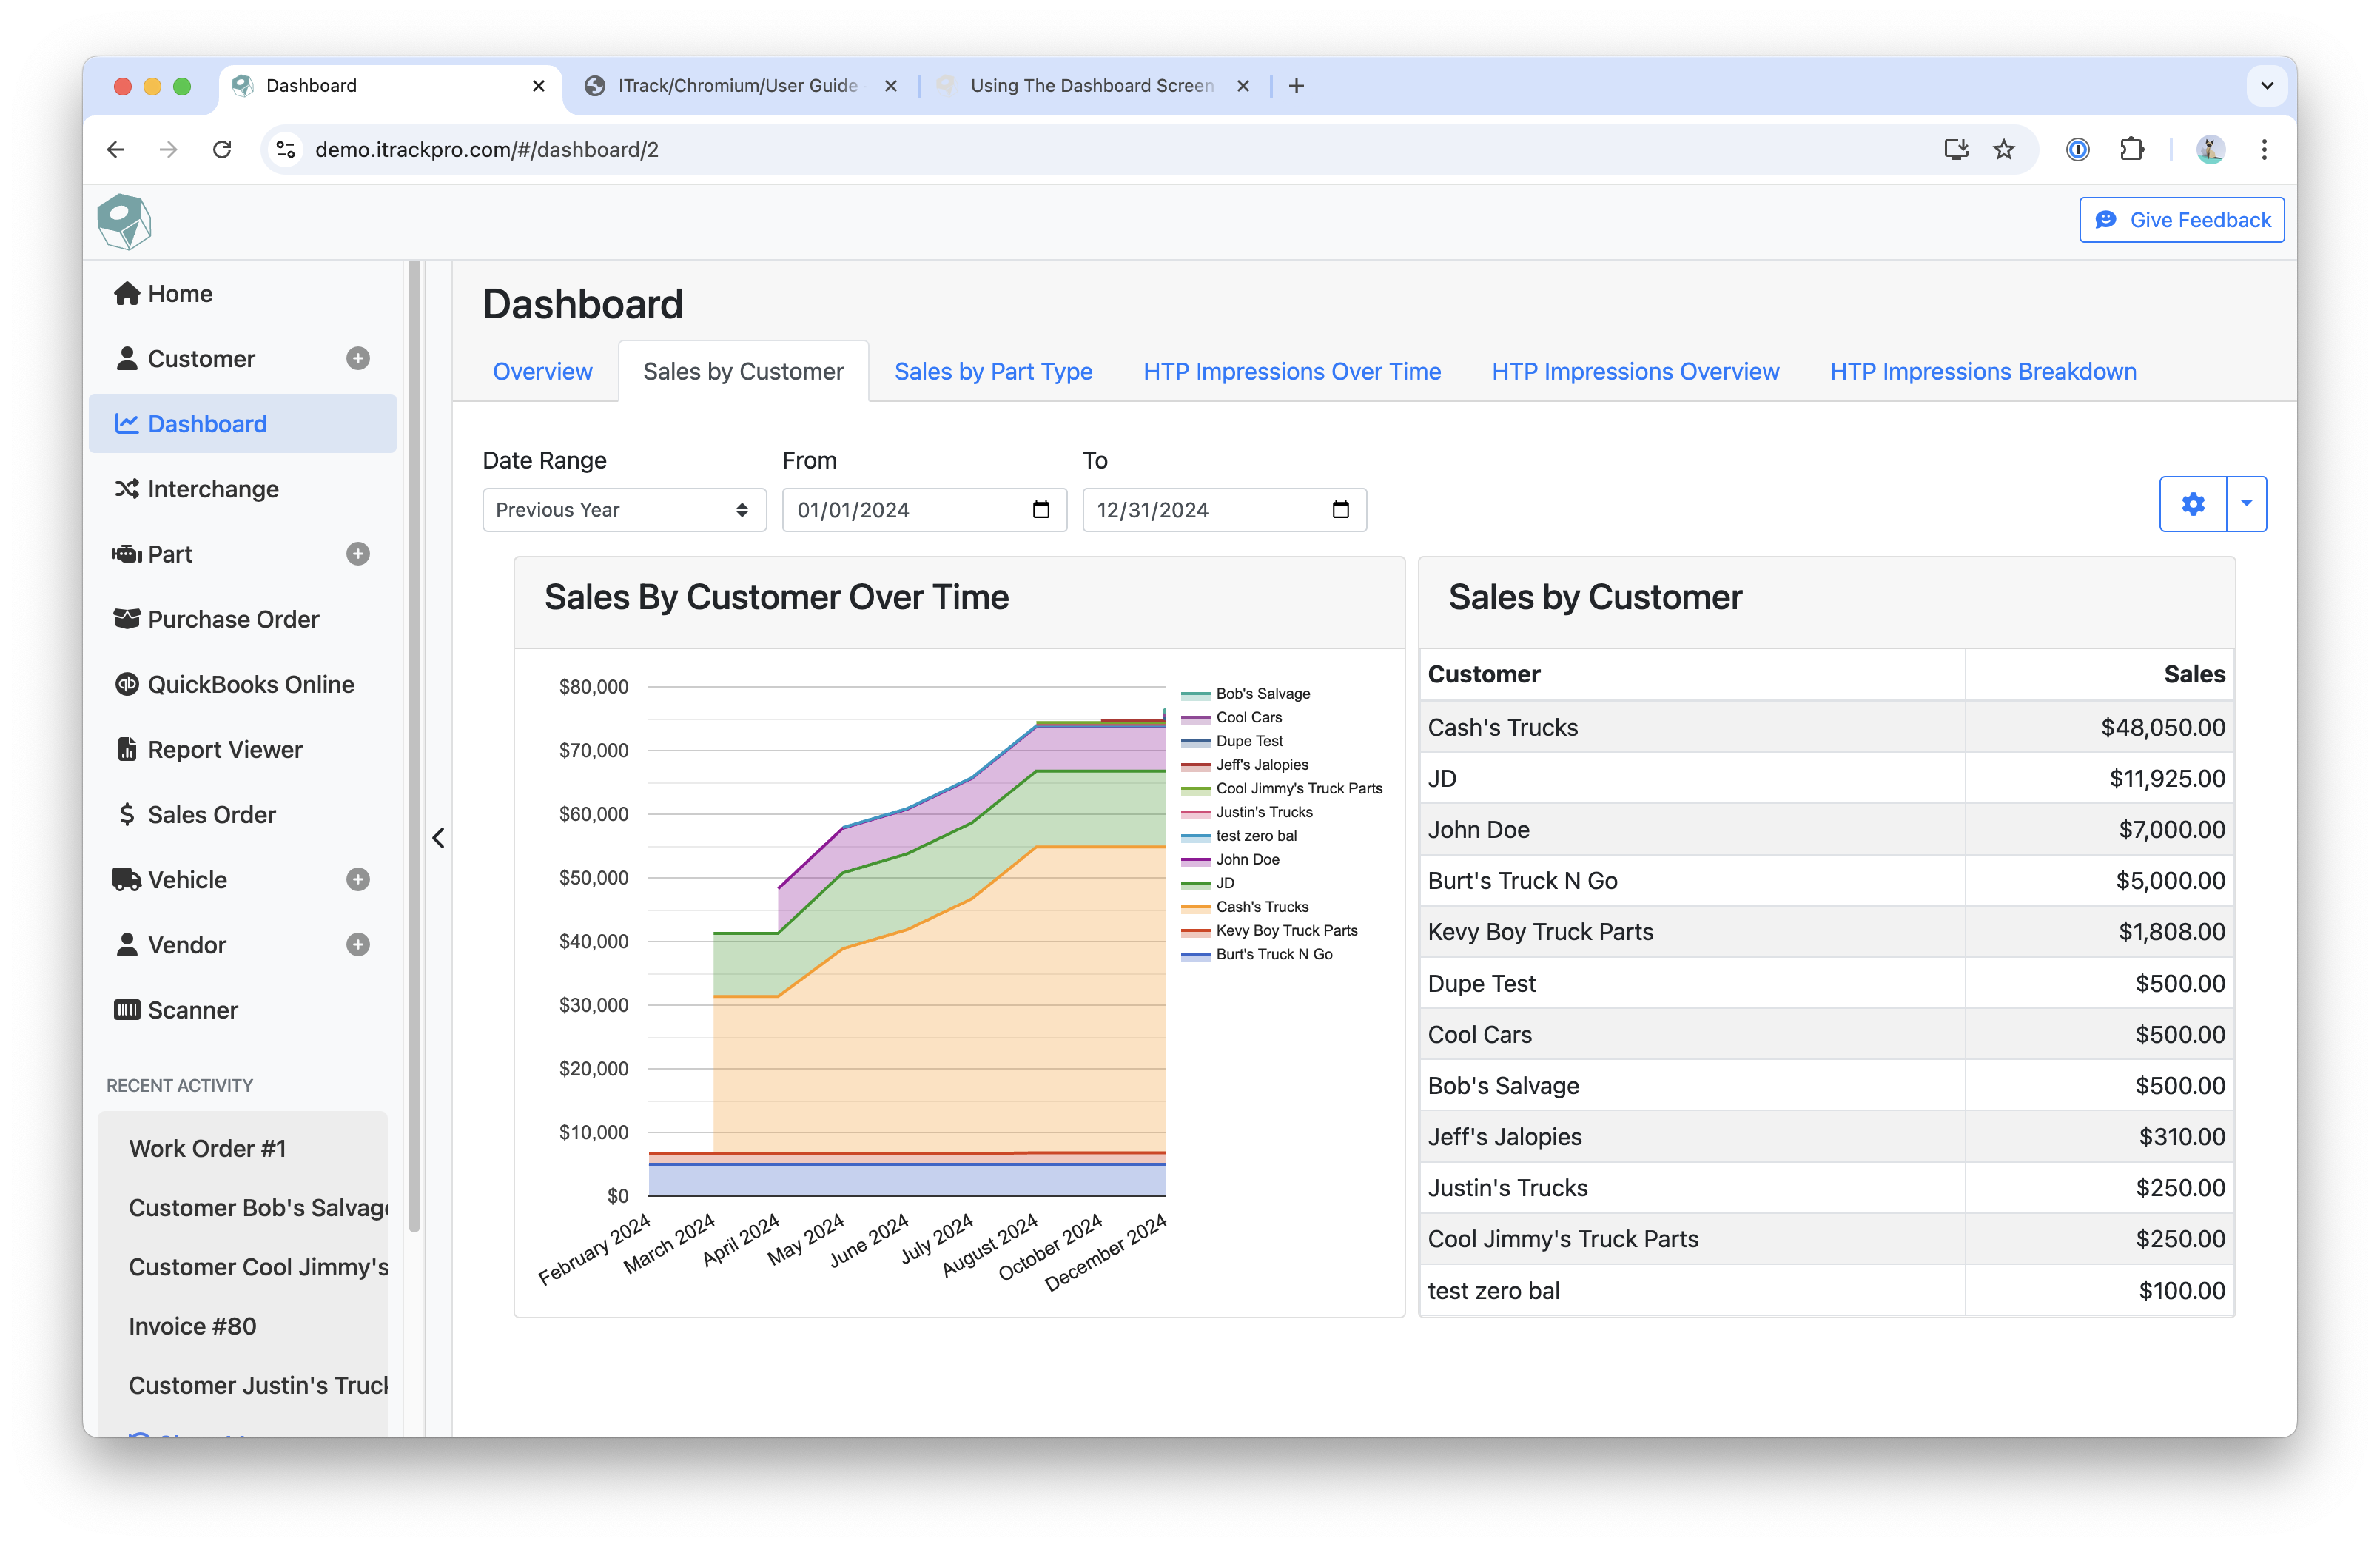
Each report that is created will be a separate tab
-
On mobile, it will be listed in a dropdown menu
-
-
Each chart inside a report is interactive and dynamic, allowing you to hover or click on data points to get more information
-
For charts that use legends, you can click on an item in the legend to hide it from the chart
-
-
Use the Date Range or Date fields to filter for data during a specific period
-
Click the blue Arrow icon for the following options:
-
Configure Report
-
Goes to the Dashboard Configuration screen
-
-
Reload Report
-
Show Parameters
-
Auto-Refresh Interval
-
Sets the time between each auto-refresh on the Dashboard
-
-
Related articles