The HTP Analytics - Single Part chart gives you an overall report of a single listing on HeavyTruckParts.net, how many people are viewing your listing, and how many views your parts have received within the dates on the chart.
This chart is very similar to the HTP Analytics - Views & Users chart, but focused on a single part.
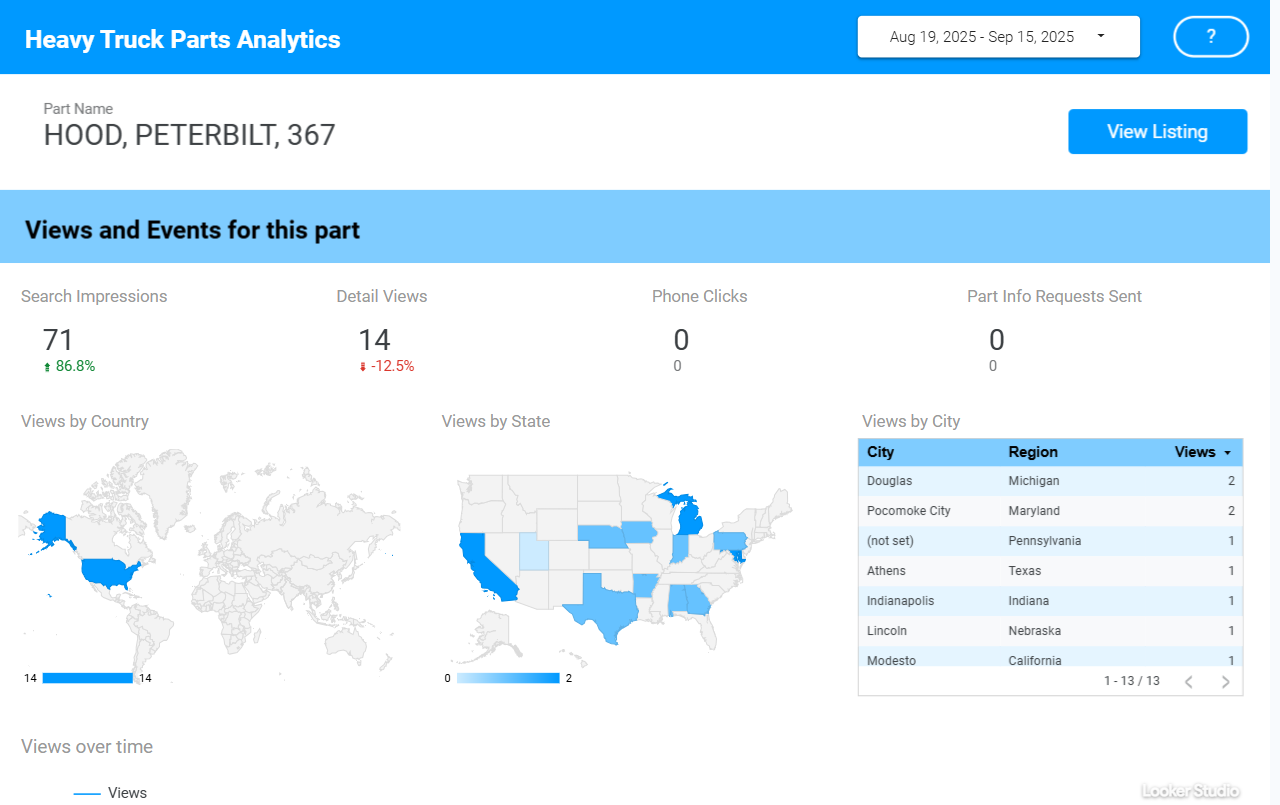
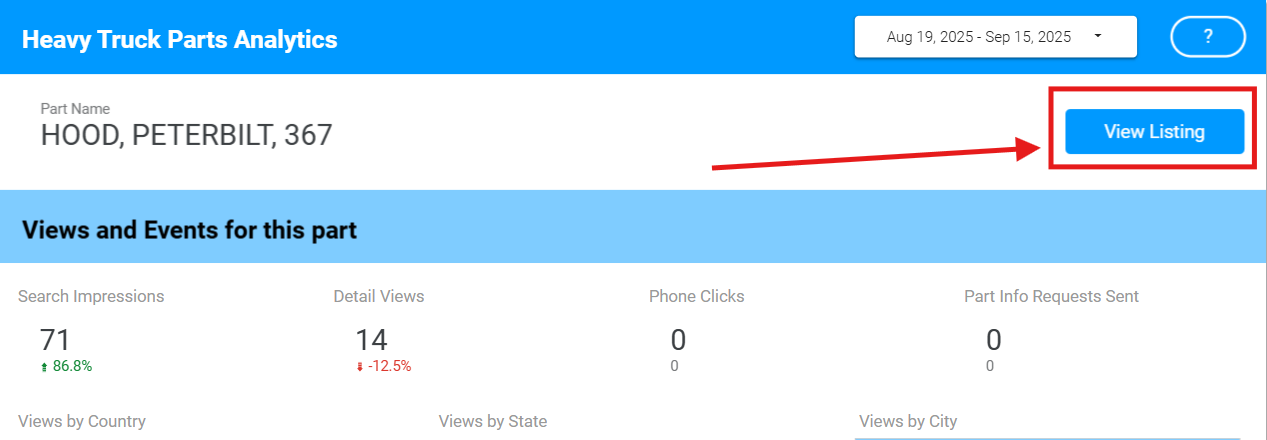
The View Listing button will open the listing on HeavyTruckParts.Net.
Part Name - Shows the item’s Part Type, Make/Manufacturer, and Model.
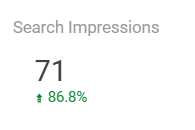
Search Impressions - The number of times the listing appeared in a search result within the chart’s time frame. The comparison below the total indicates how this number has changed since the last time period.
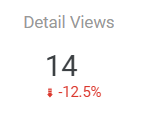
Detail Views - The number of times the listing’s detail view was opened by a user within the chart’s time frame. The comparison below the total indicates how this number has changed since the last time period.
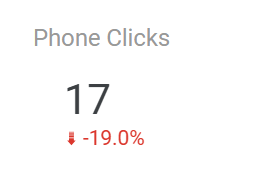
Phone Clicks - The total number of times a user has clicked the Call Vendor button on this listing, either in the Part Detail page or from a search result list. The comparison below the total indicates how this number has changed since the last time period.
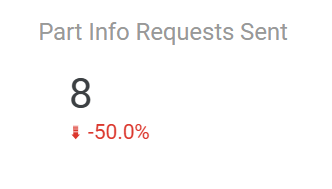
Part Info Requests Sent - The total number of times a user has clicked the Request Info button on this listing, either in the Part Detail page or from a search result list, and the user sent a message. The comparison below the total indicates how this number has changed since the last time period.
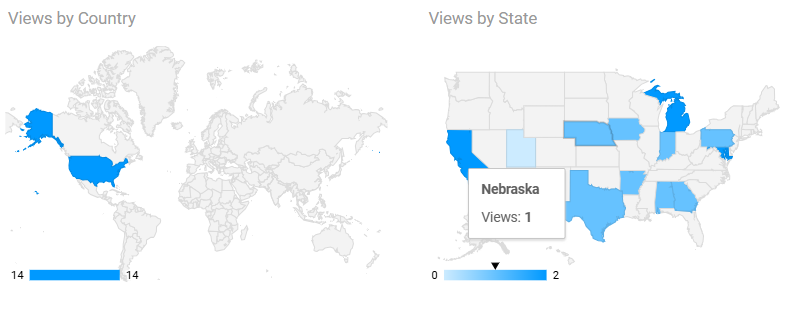
Views by Country and State - The total part detail views for this listing in the time period, broken down by geography. Hover over an area on the map to see the total count.
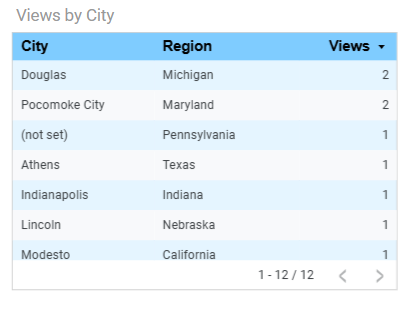
Views by City - The total part detail views for this listing in the time period, broken down by city. By default this report shows you the Region (State or Province). Click on any column header to sort by that column.
Analytic tracking data is imprecise, and some users might opt out of data tracking. In cases where you see views where the location is “Not Set”, that means a user viewed a part but didn’t opt in to tracking data.
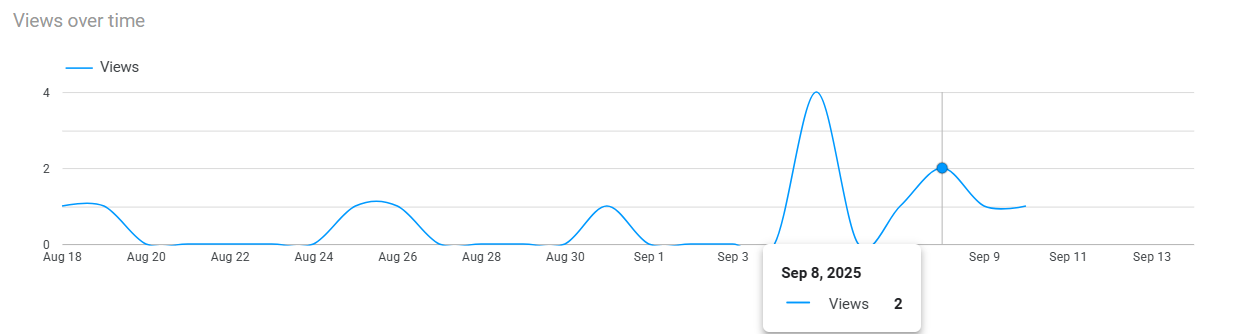
Views over Time - Shows the number of views per day within the chart’s time period. Hover over a point in the graph to see details.